
Mean vs Median vs Mode: What's the Difference?
Learn the difference between mean, median, and mode with simple formulas, examples, and real-life uses. Understand when to use each measure in statistics.
Calcifyai Team
Expert calculators & financial tools
Understanding mean vs median vs mode is one of the most important fundamentals in mathematics and statistics. Although all three describe the "center" of a dataset, they are calculated differently and are useful in different situations.
Whether you're a student solving homework, a teacher explaining statistics, or someone analyzing business or financial data, knowing when to use each measure can help you make better decisions. If you want to quickly calculate these statistical values, try our Statistics Calculator to find the mean, median, mode, variance, and more in seconds.
In this guide, you'll learn:
What mean, median, and mode are
The formulas for each
Step-by-step examples
The differences between them
When to use each measure
Common mistakes to avoid
What Are Mean, Median, and Mode?
Mean, median, and mode are called measures of central tendency. They summarize a large set of numbers into one representative value.
Each measure answers a slightly different question:
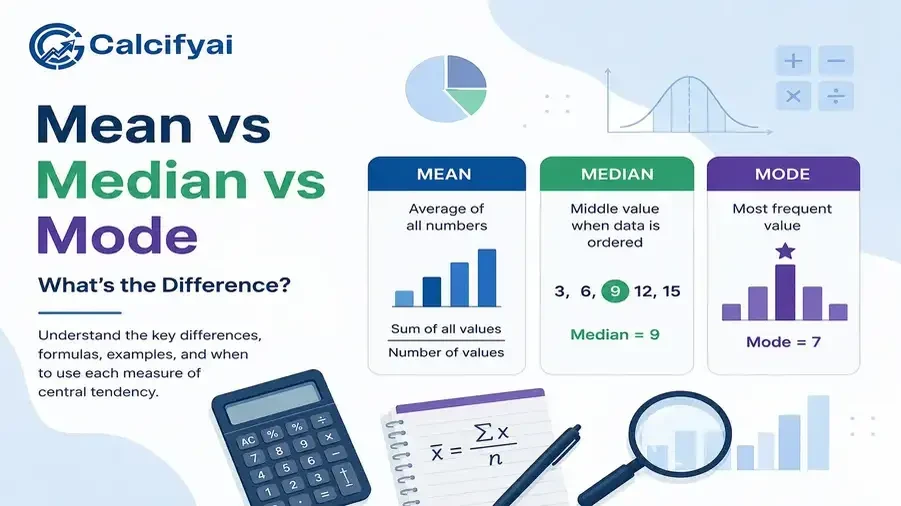
Mean → What is the average value?
Median → What is the middle value?
Mode → Which value appears most frequently?
Although they may produce the same result in some datasets, they often differ, especially when there are outliers or repeated values.
What Is Mean?
The mean is the arithmetic average.
You calculate it by adding every value together and dividing by the total number of values. If you simply need to calculate an average without doing the math manually, our Average Calculator provides instant and accurate results.
Formula
Mean = (Sum of all values) ÷ (Number of values)
Example
Dataset:
12, 15, 18, 20, 25
Mean
= (12 + 15 + 18 + 20 + 25) ÷ 5
= 90 ÷ 5
= 18
The mean uses every number in the dataset, making it very informative but also sensitive to extremely high or low values.
What Is Median?
The median is the middle number after arranging the data from smallest to largest.
If there is an odd number of values
Choose the middle number.
Example:
4, 7, 9, 13, 15
Median = 9
If there is an even number of values
Average the two middle numbers.
Example:
5, 8, 12, 18
Median
= (8 + 12) ÷ 2
= 10
Unlike the mean, the median is not greatly affected by outliers, making it useful for income, housing prices, and other skewed datasets.
What Is Mode?
The mode is the value that appears most frequently.
Example:
3, 5, 5, 7, 9
Mode = 5
Some datasets may have:
No mode
One mode (Unimodal)
Two modes (Bimodal)
Multiple modes (Multimodal)
Mode is especially useful when working with categories, survey responses, product sizes, or any data where frequency matters.
Mean vs Median vs Mode Example
Consider the following dataset:
8, 10, 12, 12, 14, 18, 50
Mean
(8 + 10 + 12 + 12 + 14 + 18 + 50) ÷ 7
= 124 ÷ 7
≈ 17.71
Median
Middle value = 12
Mode
Most common value = 12
Notice how the large value (50) increases the mean significantly, while the median and mode remain unchanged. You can verify these results instantly using our Statistics Calculator, which automatically computes multiple statistical measures from a single dataset.
When Should You Use Mean, Median, or Mode?
Use Mean When
Data has no extreme outliers
Every value is important
Calculating averages for marks, temperatures, or test scores
Examples
Average exam marks
Average monthly sales
Average daily temperature
Use Median When
Data contains outliers
You want the "typical" value
Data is skewed
Examples
House prices
Salaries
Income statistics
Property values
Use Mode When
Finding the most common item
Working with categories
Identifying popular choices
Examples
Shoe sizes sold
Favorite colors
Product demand
Survey responses
Real-Life Examples
Student Marks
Mean shows the overall class performance. For classroom datasets, using an Average Calculator is one of the fastest ways to determine the arithmetic mean.
Home Prices
Median provides a more realistic "typical" house price because luxury homes can inflate the average.
Retail Store
Mode identifies the most commonly purchased product size.
Healthcare
Median patient recovery time often represents the typical outcome better than the mean.
Advantages and Disadvantages
Mean
Advantages
Uses every observation
Easy to calculate
Commonly used in statistics
Disadvantages
Strongly affected by outliers
Can be misleading for skewed data
Median
Advantages
Resistant to outliers
Represents the center well
Good for skewed distributions
Disadvantages
Doesn't use every value
Less useful for advanced statistical calculations
Mode
Advantages
Easy to identify
Works with categorical data
Shows the most popular value
Disadvantages
May not exist
Multiple modes can complicate interpretation
Common Mistakes
Many beginners make these mistakes:
Using the mean when extreme values exist
Forgetting to sort data before finding the median
Assuming every dataset has a mode
Confusing "average" with "mean"
If you're also learning other mathematical concepts, you may find our guide on GCF & LCM Explained helpful for understanding another important math topic commonly taught alongside basic statistics.
Frequently Asked Questions
Is average the same as mean?
In everyday language, "average" usually refers to the mean. In statistics, however, average can also refer to the median or mode depending on the context.
Which is more accurate: mean or median?
Neither is universally better. The mean is ideal for balanced datasets, while the median is better when the data contains outliers or is skewed.
Can a dataset have more than one mode?
Yes. A dataset may be bimodal or multimodal if multiple values share the highest frequency.
Can mean, median, and mode all be equal?
Yes. In perfectly symmetrical distributions, all three measures can have the same value.
Why is the median not affected by outliers?
Because it depends only on the position of values in an ordered list rather than their actual magnitude.
Conclusion
Understanding mean vs median vs mode helps you choose the right way to summarize data. While the mean gives the overall average, the median identifies the middle value, and the mode highlights the most common one.
Disclaimer
The information provided in this article is for educational and informational purposes only. It should not be considered as professional financial, medical, or legal advice. Always consult with qualified professionals for specific guidance related to your situation.
Popular Calculators
Explore our most-used free calculators for finance, health, and everyday needs.