
Variance vs Standard Deviation: What's the Difference?
Learn the difference between variance and standard deviation, how they're calculated, when to use each, and why both are important in statistics.
Calcifyai Team
Expert calculators & financial tools
When analyzing data, it's not enough to know the average you also need to understand how spread out the data is. Two of the most common statistical measures used for this purpose are variance and standard deviation.
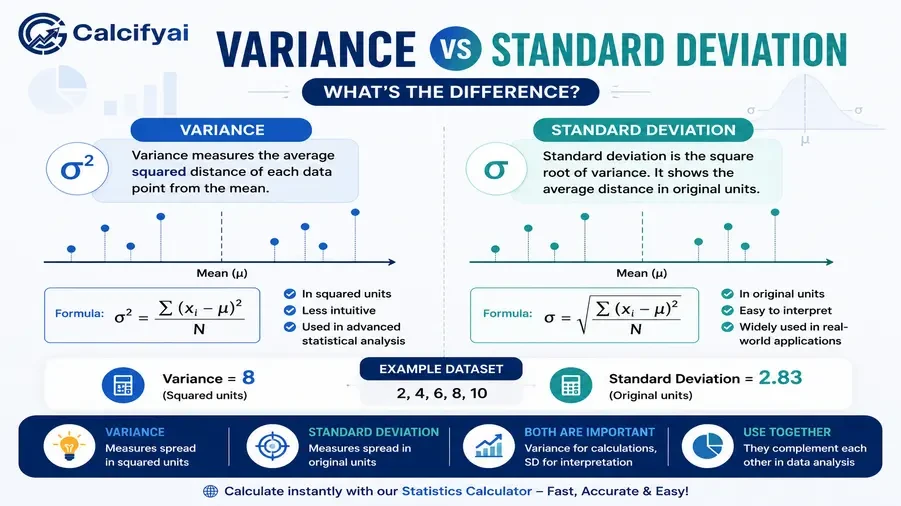
Although they are closely related, many people confuse them because both measure variability. The key difference is that variance measures the average squared distance from the mean, while standard deviation is simply the square root of variance, making it easier to interpret.
In this guide, you'll learn the differences between variance and standard deviation, how each is calculated, and when to use one over the other.
Want to calculate these values instantly? Try our Statistics Calculator to compute variance, standard deviation, mean, and other descriptive statistics in seconds.
What Is Variance?
Variance measures how far data points are spread from the mean. It calculates the average of the squared differences between each value and the mean.
A higher variance indicates that the data is more spread out, while a lower variance means the values are clustered closer to the average.
Example
Dataset:
4, 6, 8, 10, 12
Since the numbers are evenly distributed around the mean, the variance is relatively small.
What Is Standard Deviation?
Standard deviation is the square root of variance.
Because it uses the same units as the original data, it is much easier to interpret than variance.
For example:
Heights → centimeters
Weight → kilograms
Income → dollars
Unlike variance, standard deviation tells you how much values typically differ from the average in real-world units.
Relationship Between Variance and Standard Deviation
Variance and standard deviation are directly connected.
Standard Deviation = √Variance
This means every time variance changes, standard deviation changes as well.
Standard deviation simply converts the squared measurement back into the original unit.
If you're new to statistical calculations, check out our guide on Arithmetic Mean Formula to understand the first step in calculating variance and standard deviation.
Variance vs Standard Deviation: Quick Comparison
Feature | Variance | Standard Deviation |
Measures | Data spread | Data spread |
Units | Squared units | Original units |
Easy to Interpret | No | Yes |
Based on Mean | Yes | Yes |
Formula | Average squared deviation | Square root of variance |
Common Usage | Statistical analysis | Everyday data interpretation |
When Should You Use Variance?
Variance is useful when:
Performing statistical analysis
Comparing data variability
Running machine learning algorithms
Conducting probability calculations
Working with regression models
Researchers often use variance because many statistical formulas rely on squared values.
When Should You Use Standard Deviation?
Standard deviation is better when you need to explain variability in practical terms.
Common applications include:
Exam scores
Business analytics
Finance
Scientific experiments
Quality control
Sports performance
Because it uses the original units, it's much easier to communicate results.
Example Comparison
Suppose two classes have the same average exam score.
Class A
Scores are very close together.
Low variance
Low standard deviation
Class B
Scores vary widely.
High variance
High standard deviation
Although both classes have the same mean, the spread of the data is very different.
Advantages of Variance
Useful for advanced statistical analysis
Essential in probability theory
Supports regression and predictive models
Forms the basis of standard deviation
Advantages of Standard Deviation
Easy to understand
Uses original measurement units
Commonly reported in research
Helpful for comparing datasets
Widely used in business and finance
Key Differences at a Glance
Variance | Standard Deviation |
Squared measure | Square root measure |
Less intuitive | Easy to interpret |
Used in formulas | Used in reporting |
Measured in squared units | Measured in original units |
Which One Is Better?
Neither is better they serve different purposes.
Choose variance when:
Performing statistical calculations
Building mathematical models
Working with probability distributions
Choose standard deviation when:
Explaining results
Comparing datasets
Reporting variability
Presenting research finding
Most statistical software calculates both because they complement each other.
Common Mistakes
Many beginners:
Assume variance and standard deviation are identical.
Forget that variance uses squared units.
Interpret variance directly instead of standard deviation.
Ignore whether the data represents a sample or an entire population.
Avoiding these mistakes leads to more accurate statistical analysis.
Frequently Asked Questions
Is standard deviation always the square root of variance?
Yes. Standard deviation is calculated by taking the square root of the variance.
Which is easier to interpret?
Standard deviation is easier because it uses the same units as the original dataset.
Why does variance use squared values?
Squaring prevents positive and negative differences from canceling each other out and emphasizes larger deviations.
Can variance be negative?
No. Since deviations are squared, variance is always zero or positive.
Should I report variance or standard deviation?
For most reports and real-world analysis, standard deviation is preferred because it is more intuitive, while variance is often used behind the scenes in statistical calculations.
Conclusion
Variance and standard deviation are two essential measures of data variability. While variance quantifies the average squared distance from the mean, standard deviation expresses that spread in the original units of the data, making it easier to understand and communicate.
Whether you're analyzing exam scores, financial data, scientific experiments, or business metrics, understanding the difference between these two measures will help you interpret data more accurately and make better decisions.
Disclaimer
The information provided in this article is for educational and informational purposes only. It should not be considered as professional financial, medical, or legal advice. Always consult with qualified professionals for specific guidance related to your situation.
Popular Calculators
Explore our most-used free calculators for finance, health, and everyday needs.